A Multiverse Analysis Considering Different Priors for Incidental Power Poses in HCI
Abstract
The concept of power pose originates from a Psychology study from 2010 which suggested that holding an expansive pose can change hormone levels and increase risk-taking behavior. Follow-up experiments suggested that expansive poses incidentally imposed by the design of an environment lead to more dishonest behaviors. Jansen and Hornbæk applied the concept in the form of incidental power poses within HCI and reported an at best very small effect based on a Bayesian data analysis. In this article we re-analyze the data of their second experiment to consider different priors varying on two dimensions: degree of informedness and strength of belief. We discuss the robustness of Jansen and Hornbæk's findings in light of our extended analysis.
Author Keywords
Incidental power poses; multiverse analysis.
ACM Classification Keywords
H5.2 User Interfaces: Evaluation/Methodology
General Terms
Human Factors; Design; Experimentation; Measurement.
Introduction
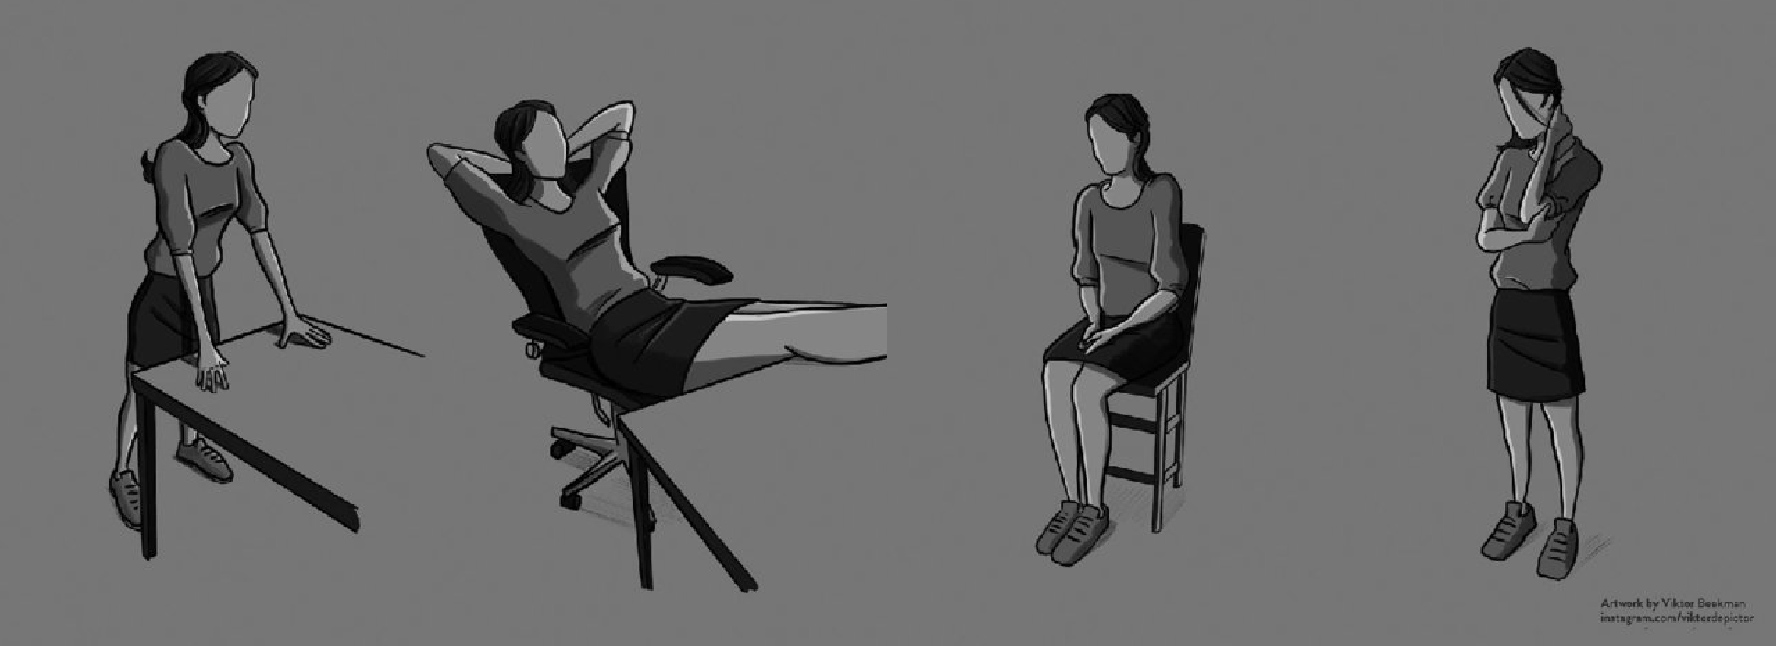
Power poses have been present even in mainstream media since their inception by Amy Cuddy and her co-authors in 2010. The basic premise is that by holding an expensive pose deemed powerful for a period of 1-2 minutes, the person holding the pose will feel more powerful and assertive, and be more likely to take risks when offered a gamble
A replication project published in a special issue of Comprehensive Results in Social Psychology found no evidence that the poses shown above have any influence on bahvior or hormone levels as claimed in the original 2010 paper. A meta-analysis of a subjective measure of felt power supports the claim of an albeit small effect (d ≈ 0.23). However, none of these replication studies tested incidental power poses: for all experiments participants were explicitly asked to take on specific poses.
In a 2018 article, Jansen and Hornbæk
We re-analyze in this article the data from their second experiment using a similar Bayesian model, since a Bayesian analysis allows us to make use of available information or our beliefs about the effect of the conditions through the use of priors. Since different studies in this domain have reported different results, there can be several, viable choice of priors for this study. As a result, arbitrarily commiting to one prior, while ignoring alternatives could either result in biased estimates. To illustrate this, let's consider a couple of possible scenarios where an author is performing the replication analysis.
In the first scenario, unknown to this author, the findings of the original study by Carney et al., by chance, chose a very unusual sample. The informed prior knowledge happens to be bad. The sample for the second study is reasonably representative. The author does not know what to do, so they drop the informative prior from their research. As it works out, this is fortunate because the happenstance of drawing an unusual sample is now avoided.
In the second example, unknown to the author, the data collected for the first study happens to be very representative of the data. Thus, using the resulting posterior as an informative prior for the replication study would be a good decision. Unfortunately, when they perform the second experiment, by chance, they happen to draw a very unusual sample. They compare the results with the two priors and drop the one with the informative prior. Unfortunately, they now have a very biased set of parameter estimates because they are unaware that they have drawn a strange sample.
Since we can never know what the true effect of power posing is, or if the data collected by Carney et al. is representative of the actual population, we investigate manipulating the prior along two dimensions: the degree of informedness and the strength of belief. By considering priors within this space, in our example, we show the influence of the choice of priors on the results and we are able to evaluate the robustness of the original analysis.
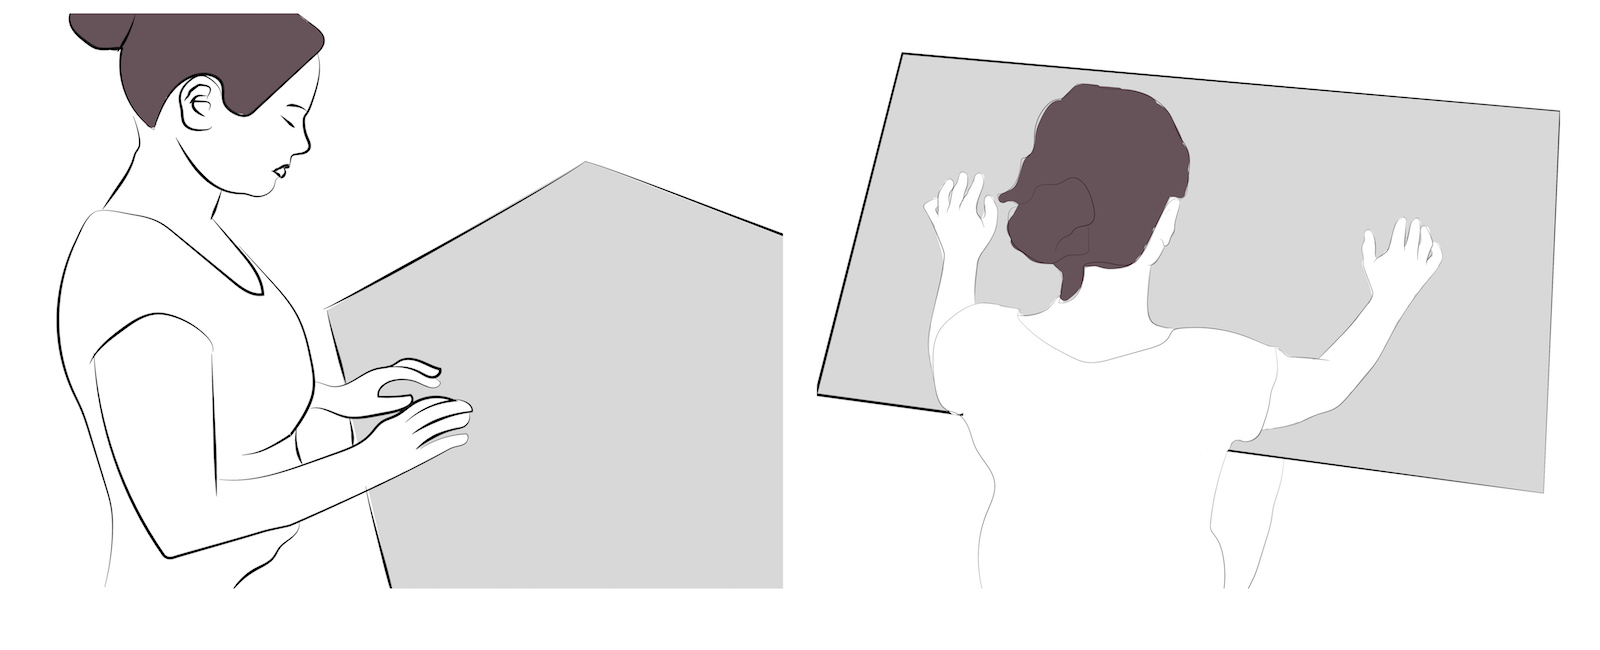
Experiment: Inclined Tabletop
Jansen and Hornbæk studied one main factor: incidental posture with two levels, expansive and constrictive (see above), implemented as two variations of the same graphical user interface. They recruited a total of 80 participants (42 women, 38 men, mean age 26) in two batches. Participants were told that they were participating in a usability study and they were not aware that two interface layouts existed. Following the protocol of the BART, participants were informed that they could increase their compensation by gaining more points in the game. The outcome measure of the experiment is the average number of pumps made on balloons which did not explode. The reasoning behind this measure is that the more participants pump, the more they have to take the risk of the balloon exploding leading to the loss of points for that balloon. The theoretically optimal behavior (unknown to participants) would be to pump each balloon 64 times. However, such a behavior has not been observed in previous work using the BART measure
Analysis
We analyze the data from Jansen and Hornbæk using Bayesian estimation, using a robust linear model described by Kruschke et al.
We assume our data to be drawn from two groups, with different means: μ = α0 + βx, where x = 0 for the constrictive (baseline) condition and x = 1 for the expansive condition. Thus, the difference between the two conditions is given by β. We use this method for the robust analysis of metric data in nominal groups.

where,
- yi indicates the number of pumps for each participant, i
- xi indicates the group (expansive or constrictive) for each participant, i
- ν indicates the degrees of freedom
- μ indicates the mean of the t-distribution corresponding to each group
- σy indicates the variance of the t-distribution corresponding to each group
- β indicates the mean difference in the number of pumps between the two groups
Here, our primary parameter of interest is β, and we set a prior on this (as well as other) parameters. A prior, which is a normal distribution in this case, is determined by the following: (1) One's degree of optimism / skepticism about an effect by manipulating the location of the mean; setting the mean at zero indicates a skeptical prior, setting the mean at a value derived from prior literature indicates an optimistic prior. (2) One's strength of belief which can be manipulated by the variance of the normal distribution; setting a narrow prior indicates strong belief about the presence or absence of an effect, a wide prior indicates weak belief about the presence or absence of an effect).
Our priors are a combination of skeptical (centerd at 0) and optimistic (centered at a value informed by prior literature), and narrow (low variance, highly regularized) and wide (high variance, weakly regularized), based on the degree of informedness, and the strength of belief. We run our analysis using a mixture calculated from 8 different priors, which allows us to interpolate between complete skepticism to complete optimism. For the optimistic priors, we use the effect-size from the meta-analysis (d = ~0.6), to calculate the mean for the Normal distribution. We show the estimates for the posterior probability distribution of β calculated using this mixture distribution of priors. We allow the reader to interact with the prior weights to set their own prior on the primary parameter of interest, β (the mean difference between the two conditions).
The default analysis uses a prior centered at effect sizes derived from the meta-analysis (d = ~0.23). We allow interaction to explore the effect of choice of priors on the result.
As per Kruschke et al.
Results
The 4 sets of most extreme priors for β are:
- Skeptical, narrow: N(0, 2)
- Optimistic, narrow: N(9, 2)
- Skeptical, wide: N(0, 10)
- Optimistic, wide: N(9, 10)
The outcome of our analysis are the posterior distributions for the parameters in our model. These distributions indicate credible values for the parameters. Below, we show the density for the posterior distribution of β, the median, and highlight the region which falls under the ROPE. You can interact with the weights for the priors to obtain the posterior for a mixture of these 4 sets of priors.
- Skeptical - Optimistic
- Narrow - Wide
Our results indicate that the probability of our estimate, β, being within the ROPE is , with the median value being .
Discussion & Conclusion
In Carney et al.'s initial paper, the authors claimed to have found a strong effect of power poses on risk taking (d = 0.6)
Hence, in our analysis, we explore the effect of choice of priors on our posterior estimates of β. We see that, for most choices of priors, the median value is in the interval [-1, 1], and the probability that the parameter lies within ROPE is close to 50%. Our results show that it highlights that large effect sizes are likely only if one has a confident (narrow) prior centered on the large effect size of the original power pose study
Our experiment found that incidental body posture did not predict participants' behavior, and this is consistent with the findings of the recent replications which elicited postures explicitly. The results of our replication find no effect of incidental power poses on risk-taking behavior, leading us to conclude that incidental power poses are unlikely to produce measurable differences in risk-taking behavior when tested across a diverse population.