Explorable Multiverse Analyses
Pierre Dragicevic (Inria), Yvonne Jansen (CNRS - Sorbonne Université), Abhraneel Sarma (University of Michigan) Matthew Kay (University of Michigan), Fanny Chevalier (University of Toronto)
With explorable multiverse analysis reports, readers of research papers can explore alternative analysis options by interacting with the paper itself. This new approach to statistical reporting draws from two recent ideas: multiverse analysis, a philosophy of statistical reporting where paper authors report the outcomes of many different statistical analyses in order to show how fragile or robust their findings are; and explorable explanations, narratives that can be read as normal explanations but where the reader can also become active by dynamically changing some elements of the explanation.
This is the companion website for the paper:
Dragicevic, Jansen, Sarma, Kay, and Chevalier. 2019. Increasing the Transparency of Research Papers with Explorable Multiverse Analyses. In CHI Conference on Human Factors in Computing Systems Proceedings (CHI 2019), May 4–9, 2019, Glasgow, Scotland UK. ACM, New York, NY, USA, 15 pages.
Useful tips before you try the examples below:
- You can animate any paper by holding the A key. Wait for all images to pre-load.
- Prefer the Chrome browser. You may experience layout issues with other browsers.
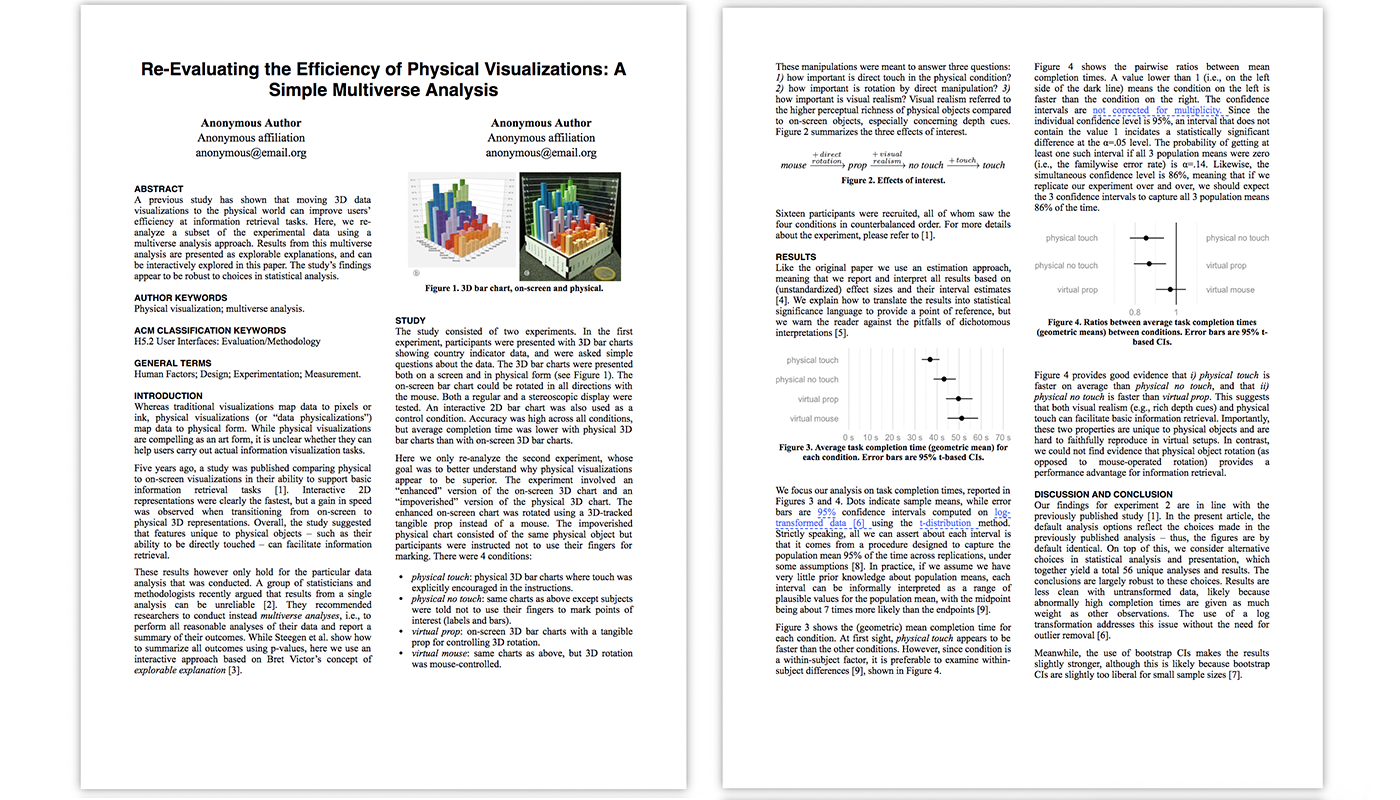
Example 1 — Frequentist
This example is a reanalysis of a CHI study evaluating physical visualizations. It is meant to illustrate a few basic multiverse analysis ideas for a classic frequentist analysis with confidence intervals.
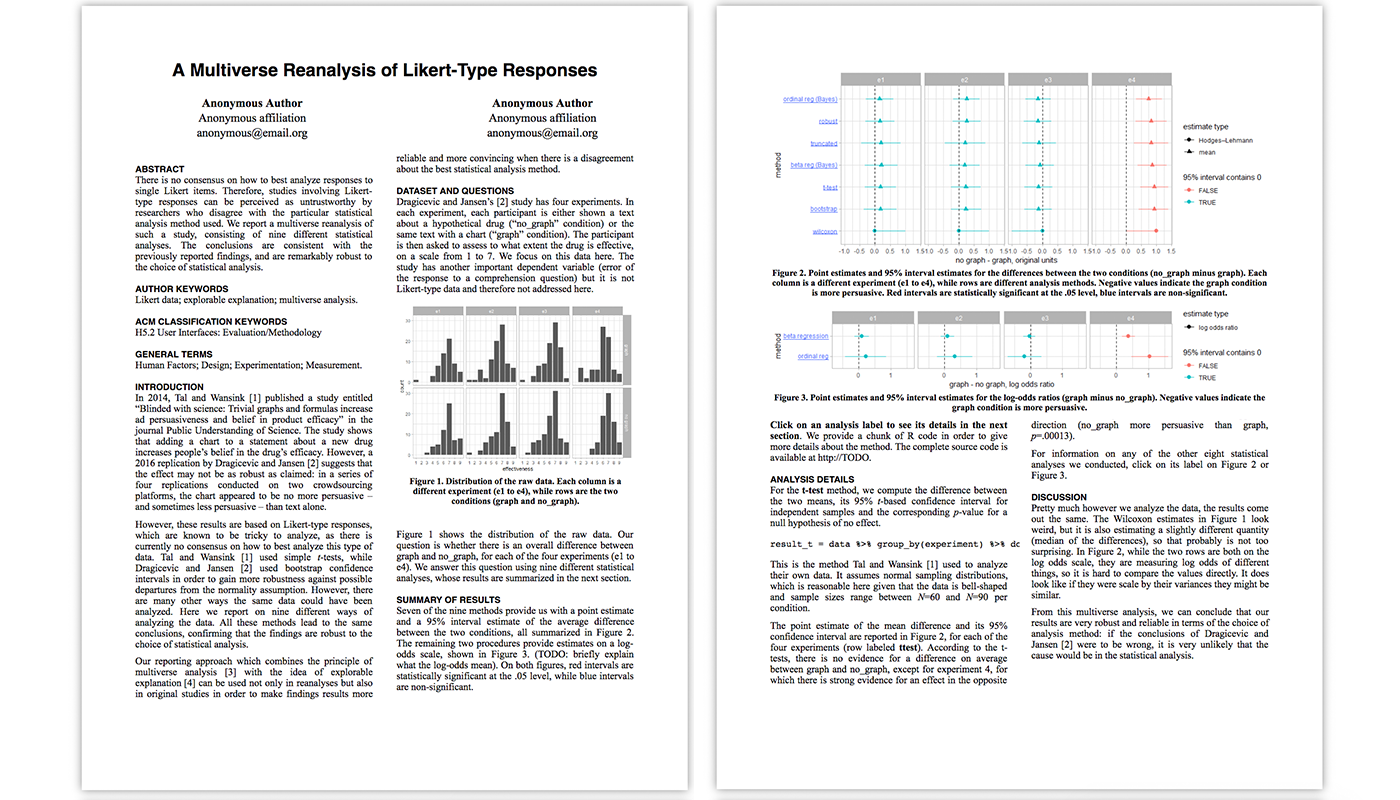
Example 2 — Likert
This example is a reanalysis of a recent InfoVis study on the effect of charts on comprehension and persuasion. It is meant to provide an example of multiple alternative analyses that differ a lot in their methodology.
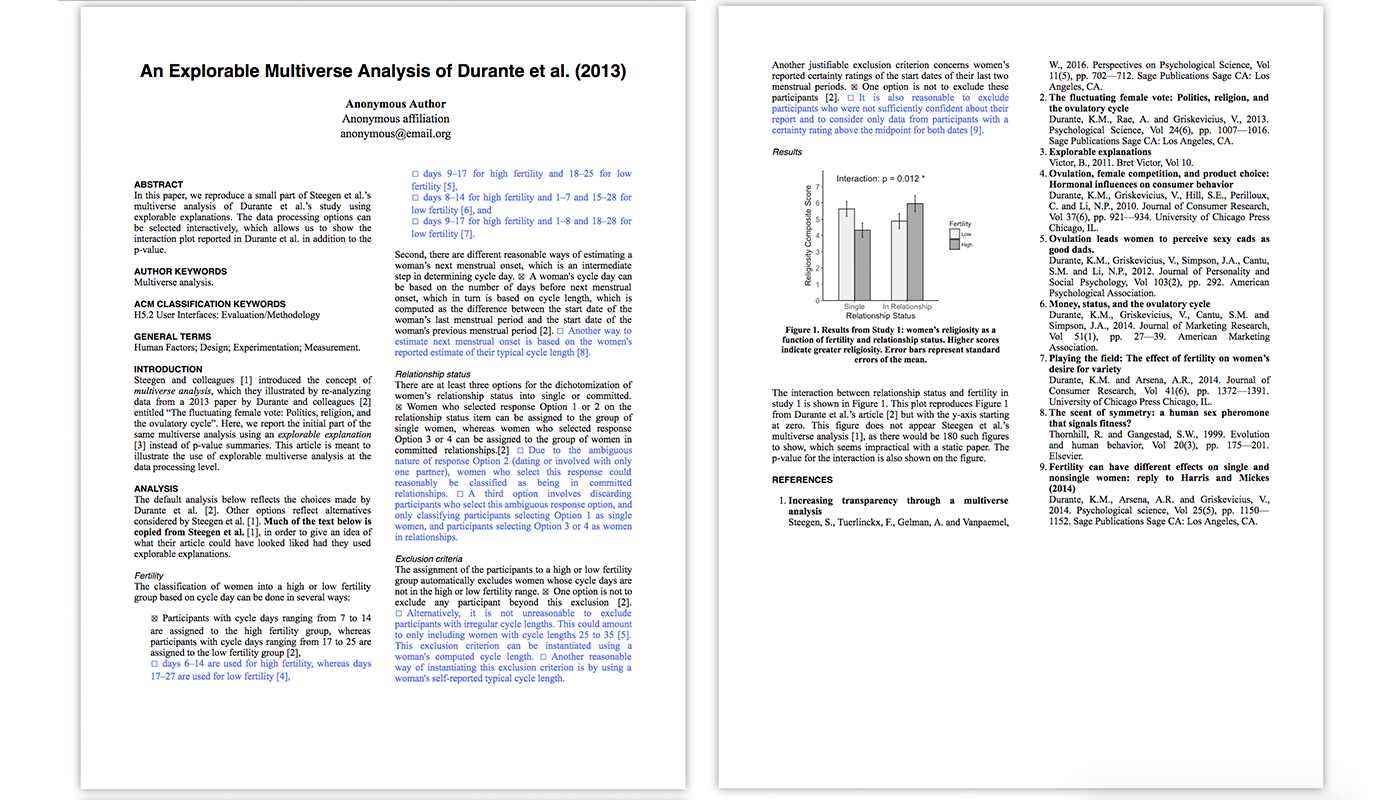
Example 3 — Dataverse
This example reproduces part of the multiverse analysis reported in Steegen et al. It is meant to illustrate alternative ways of processing experimental data (e.g., dichotomizing responses, excludingparticipants), and the use of interactive choice lists.
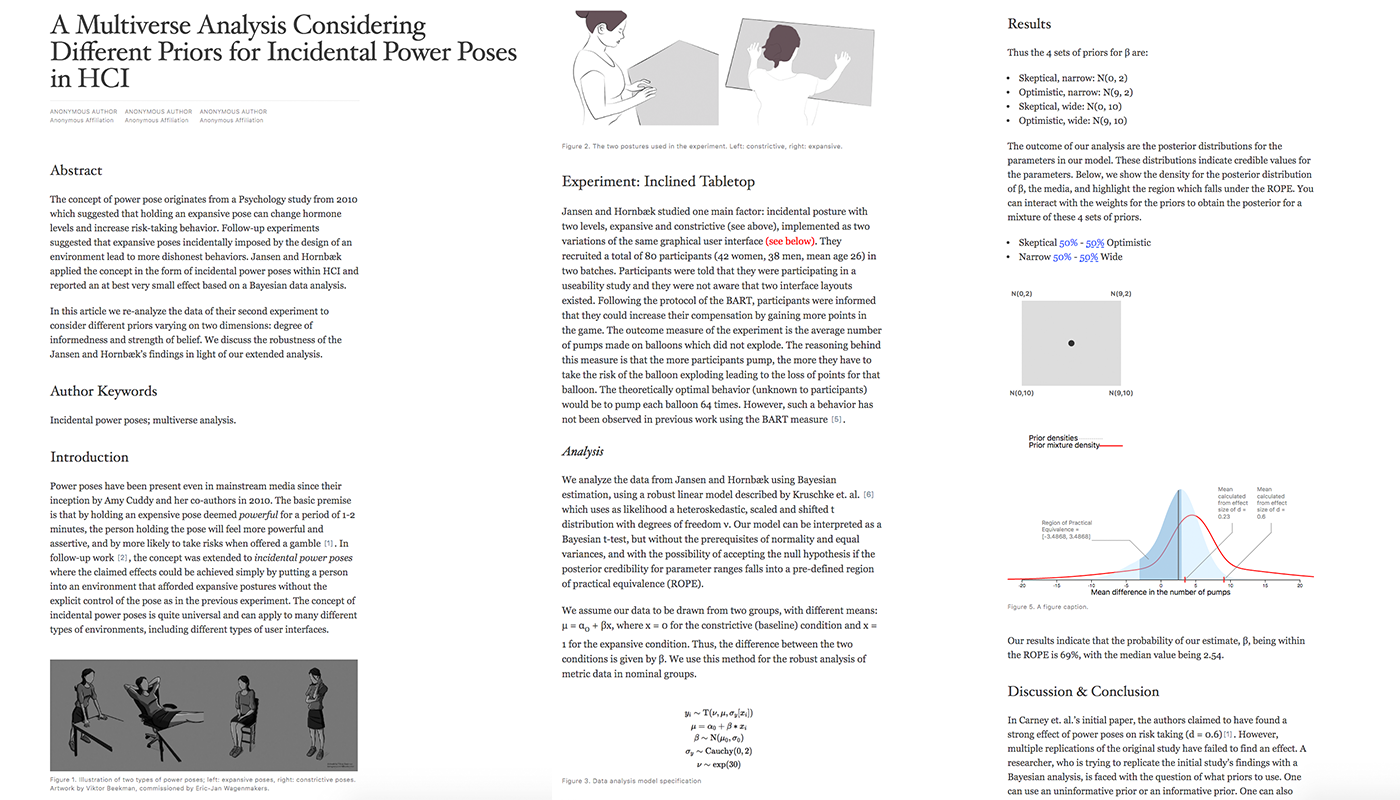
Example 4 — Prior
This example is a reanalysis of a study which examines the effect of incidental power poses on risk taking behavior. It is meant to illustrate interactive setting of a prior distribution in a Bayesian analysis.
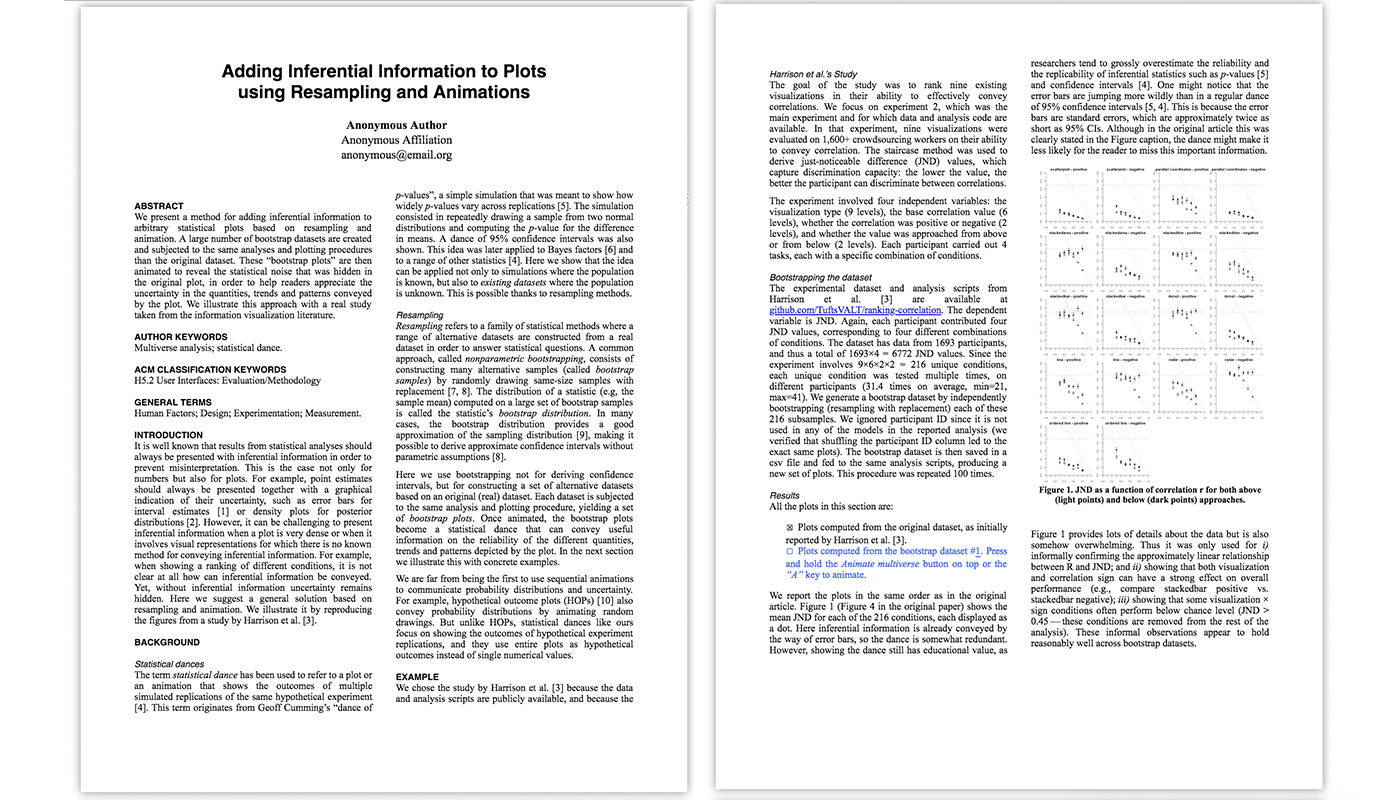
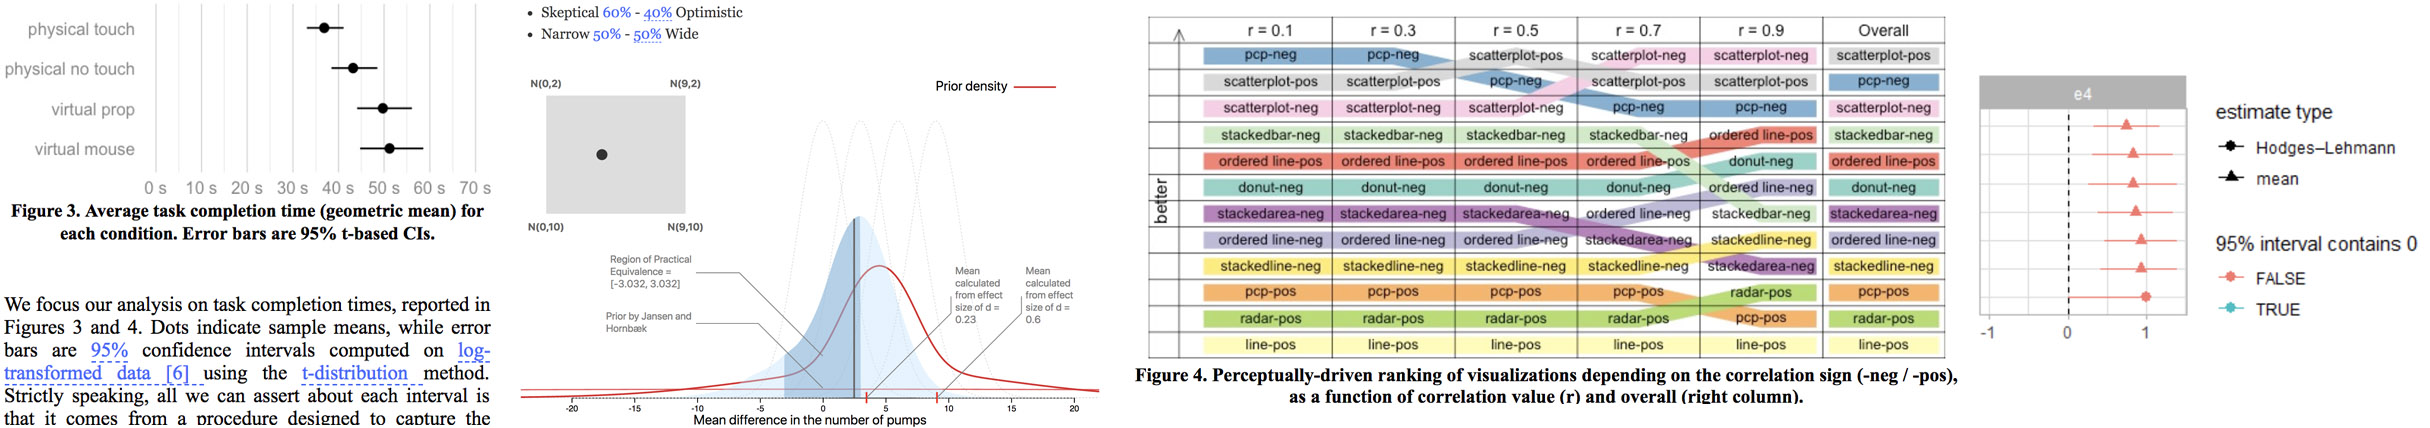
Example 5 — Dance
The is example is a reanalysis of a previous InfoVis study on the perception of correlations. It is meant to illustrate the use of simulated dataverses to convey inferential information that can be missing from plots.